Data from the Tasmanian Devil Genome Project
TABLE OF CONTENTS
Introduction
Three websites provide access to the data produced by the Tasmanian devil
genome project described in
Miller et al. 2011:
- Galaxy:
usegalaxy.org
- The Galaxy server provides tables of data associated with putative SNPs,
both genome-wide and restricted to predicted protein-coding regions.
Moreover, it supplies general-purpose tools for extracting desired subsets
of those SNPs (e.g., SNP predictions with the lowest false-positive rate,
or SNPs most likely to be evolving neutrally), as well as special-purpose
tools to facilitate the design of particular genotyping assays.
- BX Browser:
main.genome-browser.bx.psu.edu
- A variant of the UCSC Genome Browser that displays alignments of our reads
to reference assemblies, as well as visualizing putative amino-acid variants
in the context of other genome-wide data sets.
- Coding SNPs:
tasmaniandevil.psu.edu/coding_snps
- This server allows the user to enter a gene name and receive nucleotide and/or
amino-acid alignments of putative coding regions, showing differences among
individuals in the species under study as well as differences from a related
reference species.
The following examples illustrate these capabilities in more detail. We suggest
opening the sites in another window to perform the steps as we go along.
Example 1: Selecting SNPs for genotyping tumors
Here we use Galaxy
to select a set of putative SNPs and start designing some genotyping experiments.
- On the top menu bar, click on "Shared Data", then on "Genome Diversity".
Click on the name "Tasmanian devil SNPs" and scroll down to the bottom
of the page that is displayed, looking for "Peek" and "Column Assignments".
Under "Peek" you will see a few lines from the top of the file, including
a line of column headers. The table has 17 columns, which are briefly
described under "Column Assignments". Below we will use columns 11 (count
of reads from Spirit's tumor containing the first allele), 12 (count
containing the second allele), 13 (SNP quality value in the tumor sample)
and 15 (distance to the closest adjacent SNP position). Use your web
browser's Back button to return to the page of Genome Diversity data sets,
then select the checkbox for Tasmanian devil SNPs and click "Go" (telling
Galaxy to "Import to histories"). Galaxy will then ask you to select from
a list of Destination Histories; select "current history", then click on
"Import library datasets".
- Select "Analyze Data" from the top menu bar. The right panel should show
the new data set. First, we will use the general-purpose Galaxy tools to
specify a subset of the SNPs, as follows. In the left panel, click on
"Filter and Sort", then on "Filter" (the first option). Enter the condition
c11>0 and c12>0 and c13>50 and c15>200
in the box provided and click "Execute". We have thus asked Galaxy to
select positions that appear to be variant in the tumor sample, that have
particularly high SNP quality, and that are well separated from other
putative SNPs. (Separation is important when genotyping to help reduce
linkage.) When Galaxy finishes running the command, the new history
item in the right panel will turn green. Clicking on the item's name shows
that about 130,000 SNPs meet our conditions. (Clicking on the "eye" icon
will let you browse them.)
- Next, we will use the special-purpose Galaxy tools to start designing
genotyping assays. Here we assume the assay consists of using PCR to
amplify regions containing the SNP position, then using a restriction enzyme
that cuts at one variant but not the other. Start by clicking on
"Genome Diversity" in the left panel, then on "Specify a set of restriction
enzymes". Our filtered SNPs are already selected as the input data set by
default, because that is the most recent history item having the required
data format. Select some enzymes (for this example, we selected the first
ten), then press "Execute" at the bottom of the panel.
- When the command finishes, click on the name of the resulting history item
(right panel). In our case, it reported that 4,461 SNPs were chosen.
Click on the eye icon to view them, then highlight the scaffold name and
SNP position from the first two columns of, say, the second line
scf7180002526194 18022 A G 8 10 88 0 28 111 ...
with your mouse and copy that text to the system clipboard. Open the
BX Browser
in another window or tab, and click on
"Genomes" in the blue bar across the top. Choose "Tasmanian Devil" from
the "genome" pull-down selector, then clear the "position or search term"
box and paste the scaffold name and position that you copied from Galaxy
into it. Edit the position to give some surrounding context, e.g.
replacing the "18022" with "18002 18042", then click "submit".
- By default the reads from Spirit, Spirit's tumor, and Cedric are displayed,
but the browser view is very customizable. Scroll to the bottom of the
page, and from the selection box for the "Restr Enzymes" track, choose
"pack"; then click "refresh". This adds a track of restriction enzyme
recognition sites, which shows the AluI site that caused this SNP to be
selected by our Galaxy query, as well as other sites in the region.
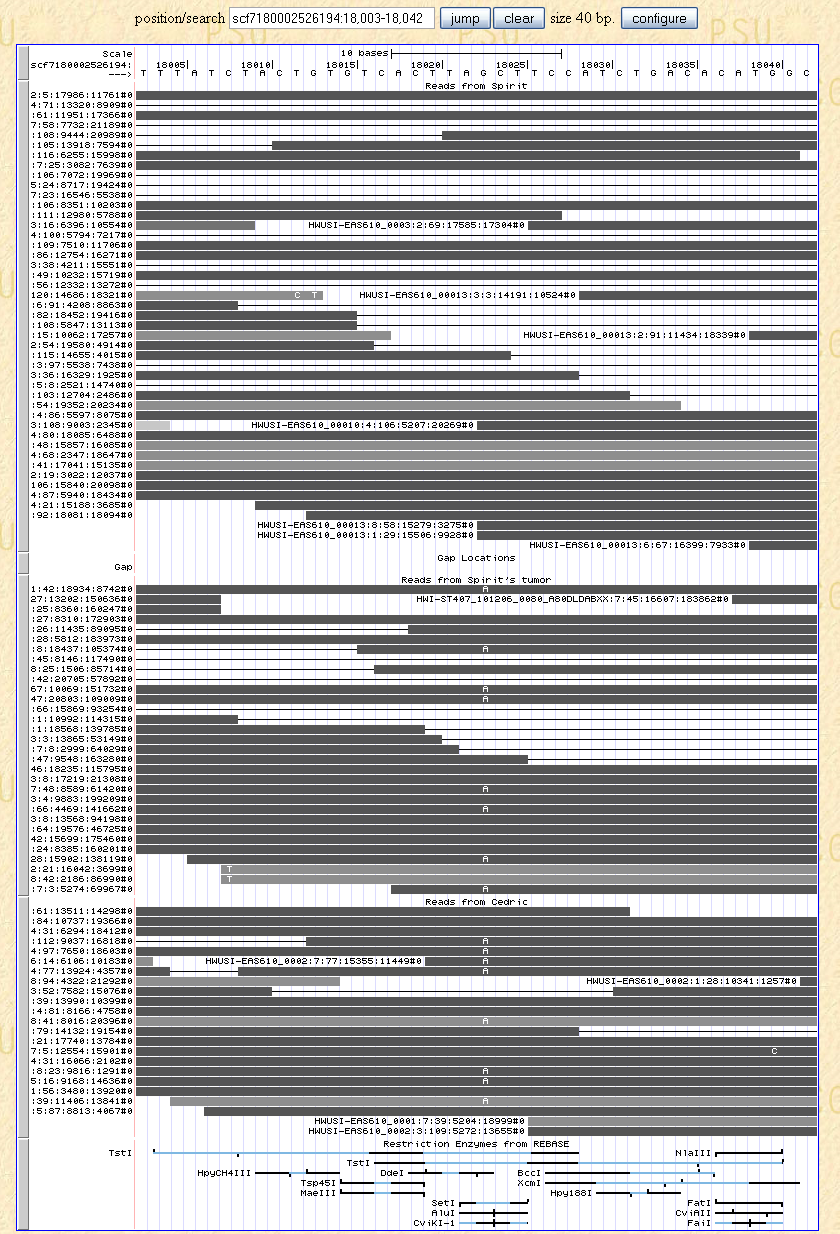
From the Galaxy result we know the alleles are A and G, and also the allele
counts obtained from Cedric, Spirit, and the tumor; for example 8 A's and
11 G's were observed in the tumor. Here we see the reads that those
numbers came from, aligned to the Tasmanian devil consensus sequence given
along the top of the panel. The reads are shown as gray bars (connected
by thin lines if paired), and mismatches from the consensus are indicated
by a nucleotide within the bar. The darker bars signify higher quality
reads. Note that the counts given in the Galaxy library tables include
only the reads that met the required criteria for quality, etc. and were
actually used for calling the variants, whereas additional reads may be
shown here (e.g. 14 G's in the tumor).
- Now return to "Genome Diversity" in the left panel of your Galaxy window,
and select "Extract primers for selected SNPs". Again the input data set
is already correct, so just click "Execute". When that command finishes,
click on its name in the history and then on the eye icon; the middle panel
shows the results. Each line describing a SNP is followed by a line
listing the differentially-cutting restriction enzymes (always including
at least one of those specified in step 3). Somewhere between the
indicated primers is a single "n", showing the SNP position (the possible
nucleotides are shown in the first line). Our program for selecting
restriction enzymes guarantees that for each of the listed enzymes,
the only recognition site between (and including) the primer sites is at
the variant position.
- Note that for technical reasons, the Genome Diversity tool to "Select
a specified number of SNPs" does not work on this one data set ("Tasmanian
devil SNPs"), though it does work on "Tasmanian devil protein-coding SNPs"
and data sets from other species (this is because the tool requires the
reads to be mapped onto a reference sequence). Its role is to find the
requested number of SNPs (or a few more) that are as widely separated as
possible relative to the reference genome.
Example 2: Widely spaced synonymous coding SNPs
When studying population structure, we want to examine SNPs that are evolving
neutrally and are well separated (to reduce linkage). We can use
Galaxy
to help select good candidates, as follows.
- In a fashion similar to step 1 of Example 1, examine
and import the data set called "Tasmanian devil protein-coding SNPs" from
the Genome Diversity shared data library. This table has far fewer lines
than the one from Example 1, since only about 1% of the genome codes for
a protein sequence. On the other hand, it has five additional columns,
numbered 5-9, giving the two amino acids (identical for a synonymous
substitution), plus the chromosome, position, and amino acid in a related,
assembled "reference" species, which in the case of the Tasmanian devil
is the laboratory opossum Monodelphis domestica. Import this
data set to your current history, as before.
- Similar to step 2 of Example 1, select Analyze Data
> Filter and Sort > Filter. This time enter the condition
c5==c6
to select the synonymous SNPs.
- Now go to the Genome Diversity section in the left panel and open the
tool "Select a specified number of SNPs". Type "100" in the "Number of
SNPs" box and click "Execute"; this will find 100 of the synonymous SNPs
(or slightly more) that are as widely spaced as possible (according to
the opossum genome).
Example 3: Non-synonymous coding SNPs (SAPs) found only in the tumor
For studying genotype-phenotype relationships such as those involved in devil
facial tumor disease, we want to discover SNPs that affect function, and
non-synonymous substitutions in coding regions are a promising place to look.
- If you have not already done so, examine and import the data set called
"Tasmanian devil protein-coding SNPs" from the Genome Diversity shared
data library into your current Galaxy
history (see step 1 of Example 2).
- Similar to step 2 of Example 1, select Analyze Data
> Filter and Sort > Filter. This time the default input data set
might not be "Tasmanian devil protein-coding SNPs" if you have generated
some other history items since then (e.g. by following Example 2), so
be sure to adjust that if necessary. Use the condition
c5!=c6 and c10==0 and c13==0 and c16!=0 and c18>=50 and c20>=100
to find some* of the non-synonymous variants
observed only in the tumor, having quality at least 50 there, and not too
close to another SNP. (*Quiz: why doesn't this
find all of them?)
- When the command finishes, examine the output as in step 4 of
Example 1. The first line begins something like this:
scf7180002576325 80734 A T Q L chr1 15494467 Q ...
This time, highlight the chromosome and position in the orthologous opossum
reference sequence (columns 7-8) as shown, and copy that text to the
clipboard. Go to the
BX Browser
and click on "Genomes" as before, but choose "Opossum" for the genome.
Paste in the position fields, edit them to give a range (e.g.
"chr1 15494457 15494477"), and click "submit".
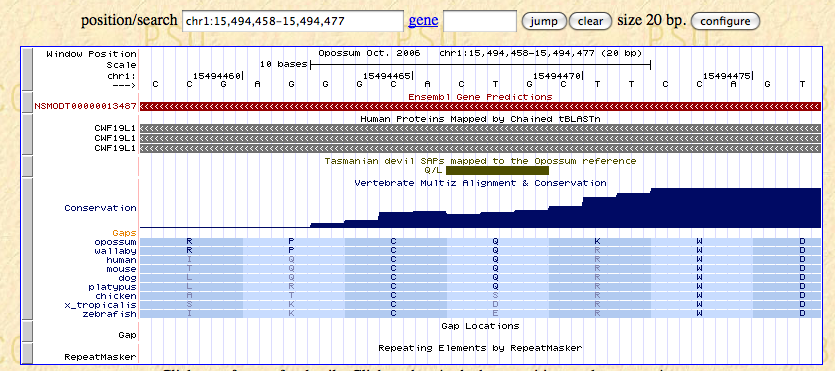
Here the SAPs are represented by green bars; in this region only the one
from our query is visible. The Q allele matches the opossum reference and
is conserved across all of the mammals shown in the conservation track's
alignment, while the L allele is unlike any of the listed species.
But interestingly, the columns from our Galaxy output showing the allele
counts observed for Cedric, Spirit, and the tumor indicate that it was the
conserved Q allele, not the L, that was found only in the tumor.
- Click on the red bar in the Ensembl Gene Predictions track to get more
information about the gene, including the gene symbol: "CWF19L1".
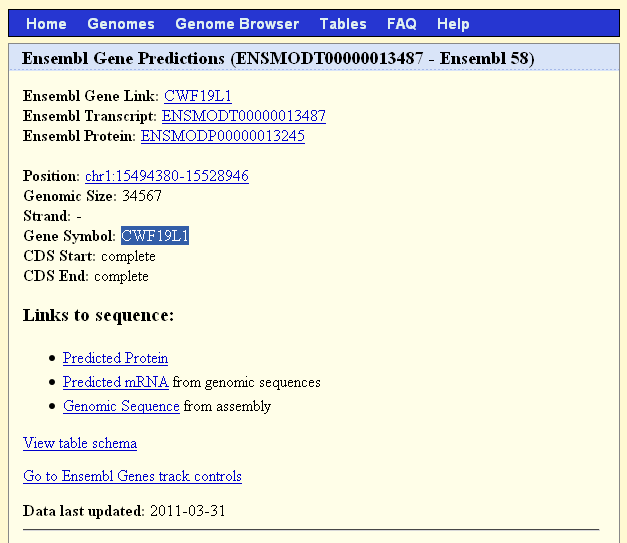
- Then open the
Coding SNPs server
in another window or tab. Choose "Tasmanian devil" from the "Species"
pull-down selector, type or paste the gene symbol from step 4 into the
"Gene" box, and click "Get SNP info".
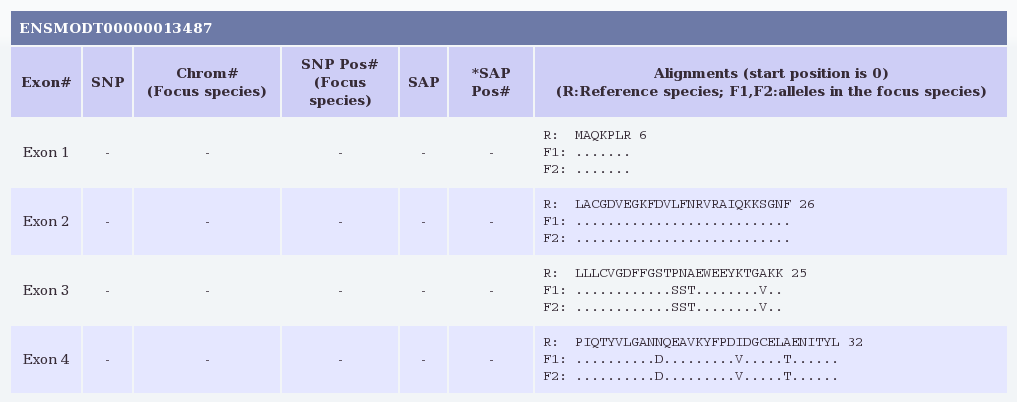
...
The results show alignments for each coding exon (i.e., excluding UTRs)
in the requested gene where the opossum and devil sequences align
sufficiently well (with at least 75% identity and no insertions or
deletions) so that the putative protein sequence for the Tasmanian devil
can be determined from the annotated opossum sequence. By default protein
alignments are shown, but DNA alignments can be requested instead (or in
addition) via checkboxes on the submission form. If the gene has multiple
transcripts, additional exons are listed in a separate table for each
transcript (but identical exons are not repeated). Any SNPs in these
coding regions are also listed; these may be synonymous or non-synonymous
(SAPs).
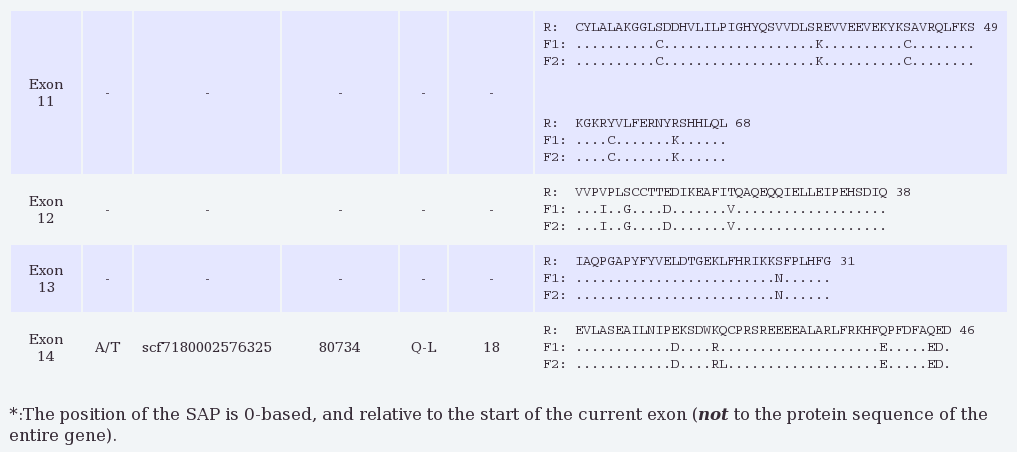
Here we see that the SAP from our Galaxy query falls in exon 14 of
transcript ENSMODT00000013487, and that both amino acids Q and L were
found in the Tasmanian devil samples. No other coding SNPs are reported
in the well-aligned exons of this gene.
References
Miller W, Hayes VM, Ratan A, Petersen DC, Wittekindt NE, Miller J, Walenz B,
Knight J, Qi J, Zhao F, Wang Q, Bedoya-Reina OC, Katiyar N, Tomsho LP,
Kasson LR, Hardie R-A, Woodbridge P, Tindall EA, Bertelsen MF, Dixon D,
Pycroft S, Helgen KM, Lesk AM, Pringle T, Patterson N, Zhang Y, Kreiss A,
Woods GM, Jones M, Schuster SC
(2011)
Genetic diversity and population structure of the endangered marsupial
Sarcophilus harrisii (Tasmanian devil).
Submitted.
April 2011